Reviewing Buffalo/Boston, Vegas/Utah, and Setting Up Montreal/Tampa Bay Game 7 – DobberHockey
Three of the eight first-round series were still active as of Friday. Buffalo led Boston 3–2, Montreal led Tampa Bay 3–2, and Vegas led Utah 3–2. The results from those three games shaped the second round bracket matchups.
Part 1 broke down the five closed series through a full PDO and shot-quality lens.
The last three series covered all share one feature: the team winning the territorial or expected-goal battle at 5v5 was not the team that was leading the series. Special teams, goaltending, and finishing variance were doing the heavy lifting on top of process.
Data from NHL API.
Buffalo Sabres defeat Boston Bruins 4–2
Series state: Buffalo tops Boston in six games.
Buffalo’s wins came in Game 1, a 4–3 comeback after a four-goal third period; Game 3, a 3–1 win in Boston; Game 4, a 6–1 demolition; Game 6, a 4-1 clincher where the Sabres were in control basically from start to finish. Boston’s wins came in Game 2, 4–2, and Game 5, 2–1 in overtime on a Pastrňák rush goal.
Buffalo’s PDO wound up 102.6, while Boston finished with 97.4.
Why it tilted Buffalo’s way: Two structural edges drove the series: territory and goaltending.
Buffalo has out-shot Boston 125–109 at 5v5, generated more high-danger looks, 52 to 44, and converted 13.5% of those high-danger chances compared to Boston’s 9.1%.
Alex Lyon has changed the series after Ukko-Pekka Luukkonen was pulled. Across five appearances, Lyon posted a .955 save percentage, including .885 at high danger. That is a +48 save-percentage-point jump over his .907 regular-season baseline.
Jeremy Swayman finished at .906, basically near his baseline, but his .833 save percentage from high danger has left Boston vulnerable when Buffalo gets inside.
What Kept Boston In For Six Games: Buffalo’s power play is the one thing keeping this series alive. The Sabres are 1-for-24, just 4.2%, despite generating 19 high-danger attempts. They have zero high-danger power-play conversions. If that unit was cashing in, the series doesn’t last as long as it did.
David Pastrnak was the player most likely to drag Boston to Game 7 with 17 shots and 2 goals through five games. His Elias Lindholm – Morgan Geekie line was out-attempted 45–24 at 5v5, but Pastrňák still found the overtime winner in Game 5.
Boston’s penalty kill was the lone elite unit on the ice. The Bruins posted a .977 penalty-kill save percentage, allowing just 1 goal on 44 shots against. This could have been a 7-game series because of the Boston penalty kill alone.
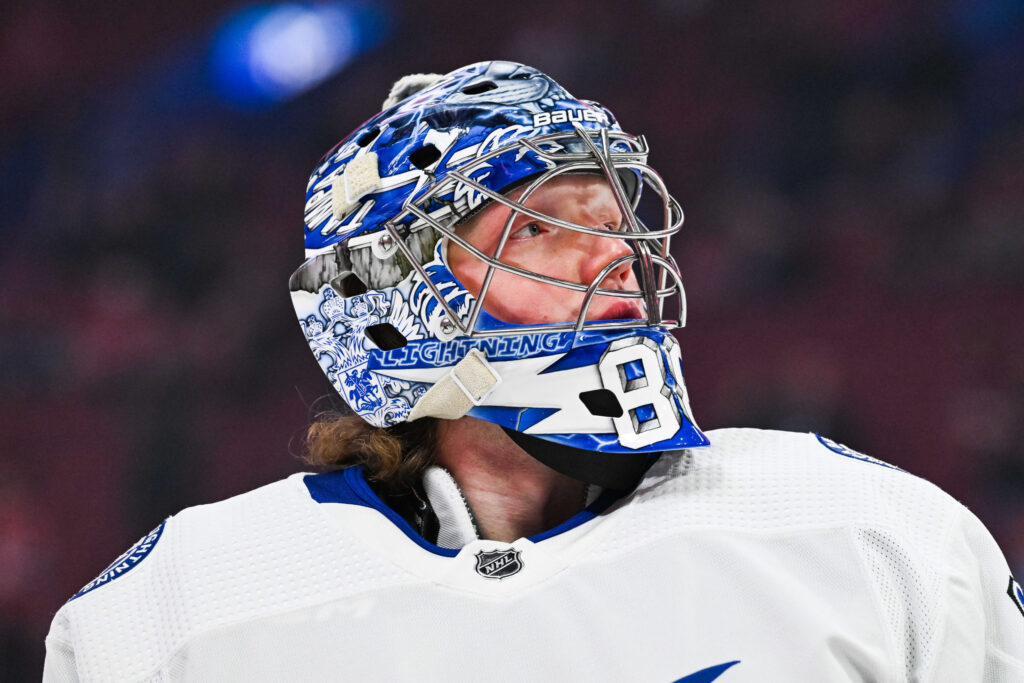
Montreal Canadiens and Tampa Bay Lightning tied 3-3
Series state: Montreal tied 3-3, with Game 7 set for Sunday in Tampa Bay.
Both Game 1 and Game 2 went to overtime, and Tampa Bay has actually out-shot Montreal at 5v5 across the six games, 114 to 102. The PDO gap is close to even: Montreal sits at 101.1 while Tampa is at 98.9.
Why it tilted Montreal’s way through five games: The biggest reason was Andrei Vasilevskiy not looking like Vasilevskiy.
Through five starts, the Vezina finalist had an .880 save percentage, including .816 at high danger. Overall, he was 32 save-percentage points below his .912 regular-season baseline, making it the largest goalie collapse of these three series in this article. The good news for Tampa Bay is Vasilevskiy turned in a vintage performance in Game 6, stopping all 30 shots he faced to force a deciding Game 7.
On the other side, rookie Jakub Dobes is at .916 overall, but he is now slightly worse at high-danger (.833) compared to Vasilevskiy (.844). Through the first five games, Tampa just did not generate enough high-danger volume to exploit it, producing only 23 high-danger shots in five games, or 17.2% of their total shot volume.
The other edge is Montreal’s power play: The Canadiens have shot 16.1% on the man advantage, scoring five power-play goals on 36 shots. Juraj Slafkovský has scored all 3 of his goals from medium-danger areas on the man advantage.
What can turn the tides in Game 7: Nikita Kucherov has 1 goal on 28 shots, with just 6 of his 19 even-strength shots from within 30 feet. His shot diet has been almost entirely perimeter-based, and he is overdue.
Brandon Hagel has been the line in the series for Tampa Bay: 6 goals on 17 shots, a 35.3% shooting percentage.
If Vasilevskiy can steal another one, or Kucherov finally gets to dangerous ice, this is Tampa’s series. If not, Slafkovský and the Montreal power play have a real chance to close it out on the road.
Vegas Golden Knights defeat Utah Mammoth 4–2
Series state: Vegas toppled Utah 4–2 thanks to a Game 6 win in Vegas.
This was the closest Western Conference series of Round 1 by goal differential up until Game 6: Vegas had 18 goals for, while Utah had 17. It was also the most paradoxical series at 5v5. Utah’s PDO was 105.5, while Vegas sat at 94.5. Utah was out-scoring Vegas 16–11 at even strength and still trailed the series.
The reason it stayed close until the final game was special teams. Vegas was 3-for-23 on the power play, converting at 13.0%, with 2 high-danger power-play goals. Utah was 1-for-26, converting at just 3.8%, with 0 high-danger power-play goals. Mitch Marner scored on the power play in Game 6, but it was the fourth goal in a 5-1 win with under eight minutes left.
Vegas’ penalty kill was excellent, posting a .968 save percentage, allowing just one goal on 30 shots. Utah’s penalty kill save percentage finished at .808.
Why it tilted Vegas’ way: The series leaned Vegas because of the special teams advantage and elite finishing from key scorers.
Pavel Dorofeyev went 3-for-4 from high-danger range, a sparkling 75% conversion rate, on his way to four total goals. Mark Stone had 2 high-danger goals on 4 attempts, converting at 50.0%. That was the difference: Vegas did not dominate territorially but finished the chances that matter.
Karel Vejmelka was solid overall through five games at .892, but he gave up four goals on 25 shots in the series-ending loss, his high-danger save percentage being the weak point at .736. Vegas generated 58 high-danger attempts at 5-on-5, the most of either team, and turned those looks into 14 goals, a 24.1% conversion rate.
What kept Utah in for six games: Jack Eichel was the obvious pressure point. He had 18 shots but only one goal, a 5.6% shooting percentage, and converted just 1 of 9 high-danger attempts.
Logan Cooley was in a similar spot for Utah: 16 shots on goal, 2 goals, and 0-for-6 from high-danger range after five games. Both top centers generated their chances and were not burying them.
What to Look for in Tampa Bay/Montreal Game 7
Montreal–Tampa is the Vasilevskiy series. He was 32 save-percentage points below his regular-season baseline after five games and then was lights-out for Game 6. The Lightning are alive because Brandon Hagel scored six goals in those first five games, allowing Vasilevskiy to come to the forefront. If Vasilevskiy can steal another one and/or Kucherov finally gets to dangerous ice, it is Tampa’s series in seven games.